E-commerce - Product Audit

Who
An Italian e-commerce cosmetics boutique, focused on premium, science-based skincare products for men and women. The company is driven by a small core team seeking to innovate in the crowded beauty and self-care market.
Challenge
- Strong product quality and growing market demand, but users had difficulty navigating the digital platform and often struggled to find key information.
- The company experienced high abandonment rates through the sales funnel, with over 50% of users dropping off before checkout completion.
- Repeated feedback from both users and internal stakeholders pointed to usability barriers affecting engagement, conversion, and long-term loyalty.
My goals:
-
Analyze the full user journey independently to uncover pain points.
-
Identify the most critical usability barriers preventing engagement or conversion.
-
Provide clear and actionable recommendations to reduce abandonment and enhance the overall experience.
- Enable the business to turn more visitors into loyal customers without in-house product design expertise.
How I Solved It / Findings
To address these issues, I conducted a targeted audit of the site’s user experience, combining direct user journey analysis with technical and heuristic evaluation. Each area below corresponds to concrete barriers and data points identified in the process.
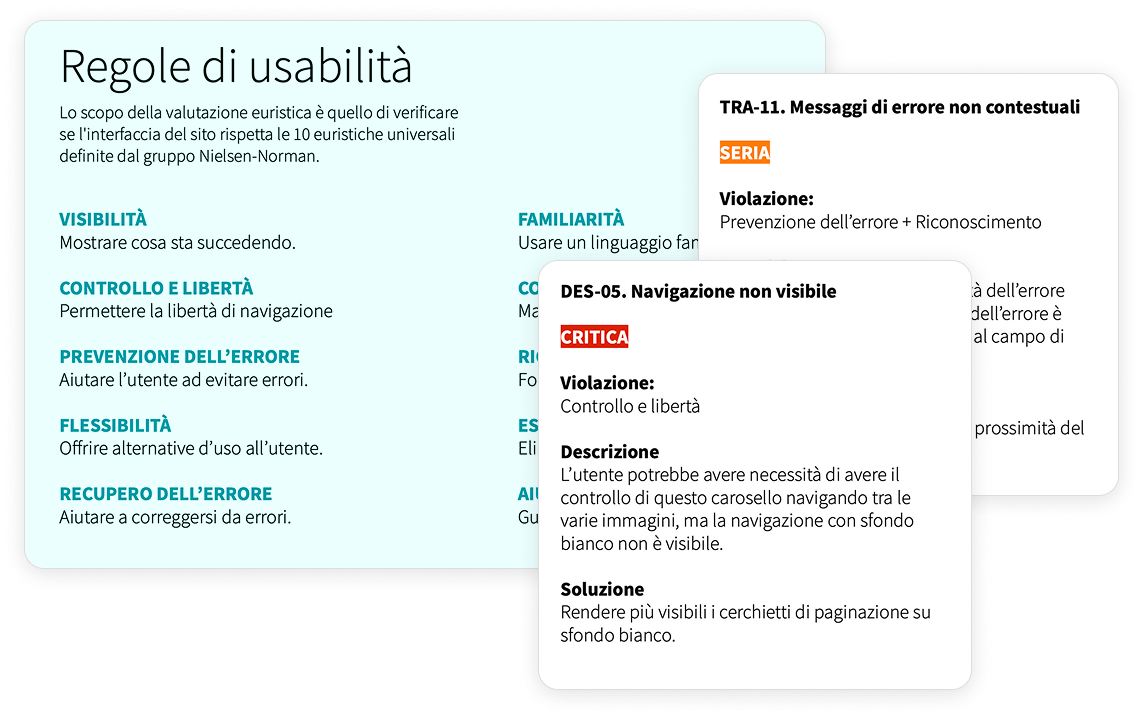
Heuristic Evaluation
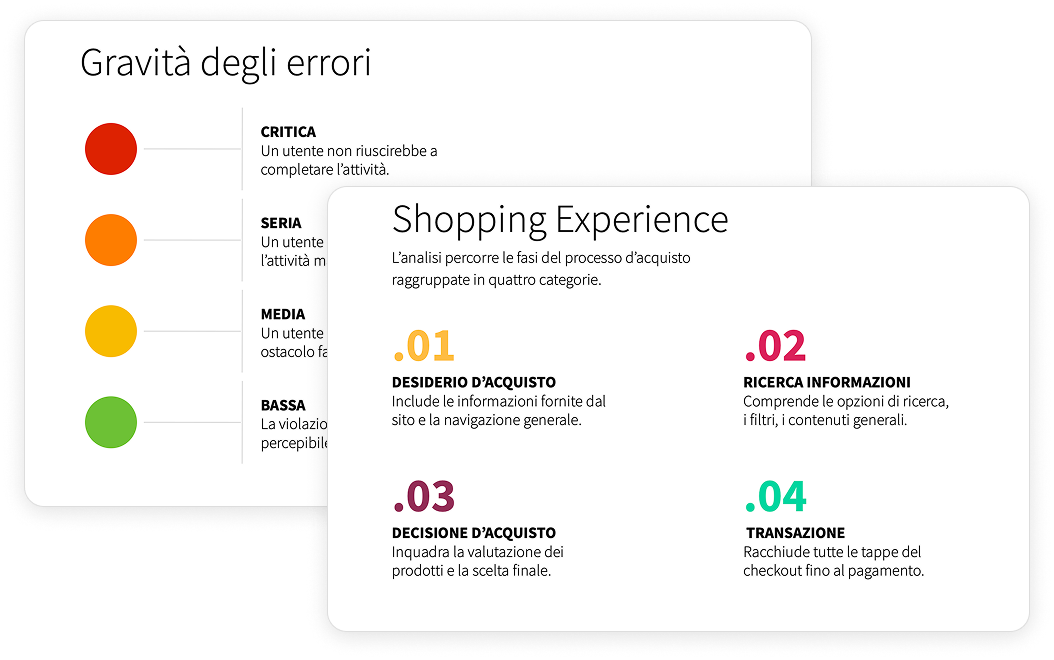
Reviewed the platform’s interface using established usability heuristics, such as visibility of system status, user control, prevention and handling of errors, consistency, recognition, and minimalism. Catalogued violations by severity and mapped them to actionable changes.
Journey Mapping & Audit
Broke down the user experience into key stages, such as landing on the homepage, browsing product categories, viewing product pages, adding items to the cart, and completing checkout.
For each of these steps, I identified exactly where users interacted with the site, what information or actions they needed, and where confusion or friction occurred. This approach allowed targeted analysis: for example, by looking at how easy it was for a user to find a product, what happened when they tried to add it to their cart, and if they encountered problems or dropped off before completing a purchase.

Navigation and Content Clarity
Identified and documented major barriers including ineffective menu order, small fonts, poor contrast, and language inconsistencies that hurt usability and trust.
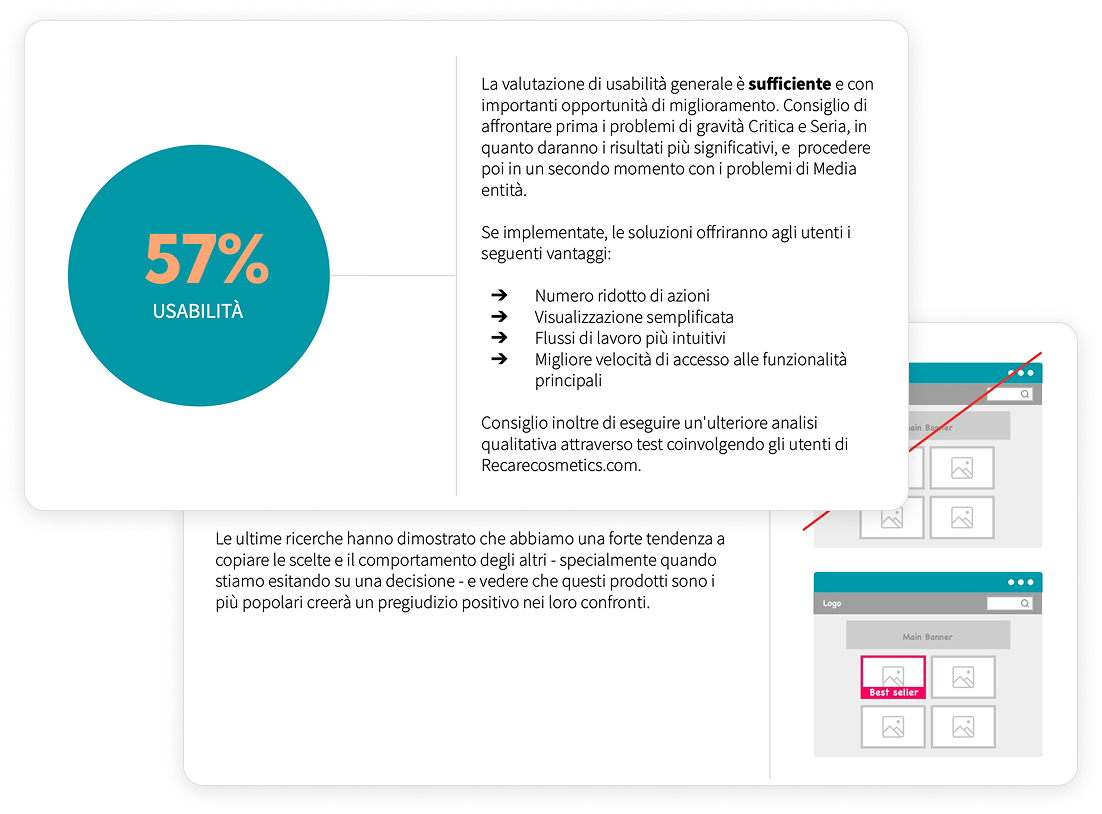
Actionable Improvements & Metrics
Delivered a prioritized action plan for changes streamlining navigation and checkout, enhancing readability and accessibility, and standardizing language. For measuring progress, I recommended tracking these metrics:
- Task completion rate: Percentage of users successfully finishing key processes.
- Abandonment rate: Where and why users leave at each step.
- Error frequency: How often and where critical errors occur.
- Accessibility scores: Lighthouse audit results for each core page.
- Customer satisfaction: Collected via surveys after improvements.
Results & Recommendations
- Created a focused roadmap that directly addressed key friction points in navigation, content clarity, checkout process, and accessibility.
- Estimated, based on identified barriers and benchmarked improvements, that the proposed changes could reduce abandonment rates by up to 20%, raise Lighthouse accessibility scores above 95, and increase the overall task completion rate.
- Recommended the company adopt a continuous improvement loop with monthly tracking of task completion, abandonment, error rates, Lighthouse auditing, and user feedback for ongoing optimization.
- Encouraged use of A/B testing to validate the impact of each major change before and after deployment.
Outcome
Six months after implementing the recommended changes, the company reported:
1. Abandonment rate dropped by 18% at the main checkout process.
2. Lighthouse accessibility scores improved from an average of 84 to 93 across key pages.
3. Task completion rate increased by 15%, indicating a smoother and more engaging user journey.
4. Customer satisfaction scores improved by 21%, based on targeted post-purchase surveys.
The company received positive feedback from returning customers about ease of use and design updates, with a noticeable lift in repeat purchases over the previous quarter.